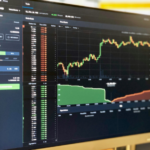






Introduction to Stock Market Analysis
The stock market plays a fundamental role in the economic landscape, providing a platform for the buying and selling of company shares. Mastering stock market analysis is crucial for investors aiming to navigate this intricate environment effectively. By understanding various analytical approaches, investors can make informed decisions that align with their financial goals.
Stock market analysis can be categorized into two primary types: fundamental analysis and technical analysis. Fundamental analysis focuses on evaluating a company’s financial health and determining its intrinsic value. It takes into account various factors such as earnings reports, balance sheets, and industry trends, thereby allowing investors to ascertain whether a stock is undervalued or overvalued based on its core performance indicators.
On the other hand, technical analysis revolves around studying historical price movements and trading volumes to predict future performance. This method employs various charting tools and indicators, helping investors identify trends and potential market entry or exit points. Unlike fundamental analysis, which typically considers long-term investment strategies, technical analysis can be used for short-term trading tactics, often emphasizing price patterns and market psychology.
Both forms of analysis complement each other and provide a comprehensive framework for assessing stock market potential. Understanding the nuances of each can significantly enhance an investor’s ability to make strategic choices. As we delve deeper into the subject of stock market analysis tools, recognizing the relevance of both fundamental and technical perspectives will help investors harness the strengths of each approach effectively.
Understanding Fundamental Analysis Tools
Fundamental analysis is a critical component in evaluating stocks, as it allows investors to determine a company’s intrinsic value based on various financial metrics. Central to this process are several key tools that provide insights into a company’s performance and its potential for future growth. Among these, financial statements, earnings reports, and economic indicators play a crucial role in a robust analysis.
Financial statements, including the income statement, balance sheet, and cash flow statement, offer a comprehensive overview of a company’s financial health. The income statement details revenues, expenses, and profits over a specific period, helping investors gauge the company’s profitability. Conversely, the balance sheet outlines a company’s assets, liabilities, and equity at a single point in time, providing insight into its financial stability. Lastly, the cash flow statement highlights cash inflows and outflows, illustrating how well a company manages its cash position, which is vital for operations and growth.
Earnings reports are periodic summaries that provide insights into a company’s profitability, often influencing stock prices significantly. These reports usually feature earnings per share (EPS), which is a key metric for investors, as it indicates how much money a company makes for each outstanding share. Analyzing variances from previous quarters or analysts’ expectations can reveal trends concerning a company’s operational efficiency and market position.
Moreover, economic indicators, such as GDP growth rates, unemployment rates, and inflation, are vital for contextualizing a company’s performance within the broader economy. These indicators help investors understand macroeconomic trends that could affect earnings, leading to more informed investment decisions. By effectively utilizing these fundamental analysis tools, investors can better assess stocks and identify opportunities for potential investment, thereby enhancing their overall investment strategies.
Exploring Technical Analysis Tools
Technical analysis tools are essential for investors seeking to predict price movements in the stock market. These tools help visualize trends and patterns in price data, offering insights into potential future movements. Among the most commonly used tools are trend charts, candlestick patterns, and various indicators such as moving averages.
Trend charts are an indispensable part of technical analysis. They display historical price movements over different time periods, allowing investors to identify upward and downward trends. By recognizing these trends, investors can make informed decisions about entry and exit points in their trades. For instance, a sustained upward trend may signal a good opportunity to buy, while a downward trend might suggest selling or shorting stocks.
Candlestick patterns serve as another critical component of technical analysis. Each candlestick reflects price activity over a specific time interval, showcasing the open, close, high, and low prices. Various formations—such as dojis, hammers, and engulfing patterns—signal potential reversals or continuations of trends. Understanding these patterns can enhance an investor’s ability to gauge market sentiment and make predictions about future price movements.
Additionally, technical indicators like moving averages play a pivotal role in smoothing price data to identify trends more clearly. Moving averages help investors ascertain whether a stock is trending upwards or downwards by averaging past prices over a designated time frame. Variations, such as the simple moving average (SMA) and the exponential moving average (EMA), allow for diversification in analysis techniques. By applying these indicators in conjunction with trend charts and candlestick patterns, investors can formulate strategies that optimize their investment decisions.
Utilizing Stock Screening Software
In the realm of stock market investing, time is of the essence. Investors are constantly seeking to identify promising opportunities while minimizing risk. Stock screening software serves as an invaluable tool for this purpose, allowing users to filter through a plethora of stocks based on predefined criteria. These criteria can range from fundamental metrics such as price-to-earnings ratios, market capitalization, and dividend yields, to technical indicators including recent price movements and trading volumes.
The fundamental advantage of utilizing stock screening software lies in its ability to streamline the investment process. Instead of manually sifting through numerous stocks, which can be both time-consuming and overwhelming, investors can quickly narrow their focus to a manageable number that meets their investment strategy. For instance, an investor looking for growth stocks may employ a stock screener to filter for companies with a high projected earnings growth rate and a substantial market presence. This targeted approach not only saves time but also enhances decision-making by providing a curated list of potential investments.
Moreover, these tools often come equipped with advanced filtering capabilities, allowing users to customize their searches based on personal investment objectives. For example, investors can set parameters to find stocks that are undervalued, have a track record of consistent dividend payments, or fit into specific sectors. By harnessing such sophisticated stock screening software, investors can efficiently identify those stocks that align with their economic outlook and risk tolerance.
In conclusion, mastering stock screening software is an essential skill for modern investors. By leveraging these tools, investors can not only save time but also enhance their ability to identify lucrative investment opportunities, ultimately leading to more informed financial decisions.
Leverage Investment Research Platforms
Investment research platforms play a critical role in the decision-making process for investors by providing essential tools and resources necessary for effective market analysis. These platforms aggregate data from a multitude of sources, offering comprehensive insights into various financial instruments including stocks, bonds, ETFs, and mutual funds. By leveraging these platforms, investors can enhance their understanding of market dynamics, identify trends, and make informed decisions.
One of the primary advantages of investment research platforms is the availability of in-depth analysis. Many platforms feature reports from seasoned analysts, highlighting significant market events, sector performance, and stock evaluations. This analysis often includes technical analysis metrics, charting tools, and quantitative data that aid in evaluating potential investment opportunities. With this wealth of information at their disposal, investors can better align their strategies with market realities.
In addition to analytical tools, these platforms also provide real-time news feeds and market insights. Timely updates on economic indicators, company earnings, and geopolitical events are vital for investors wishing to react quickly to market fluctuations. Keeping abreast of pertinent news allows investors to adjust their portfolios intelligently based on current circumstances. Many platforms also feature customizable dashboards that enable users to monitor specific investment signals, market indices, or stock performance tailored to their individual strategies.
Furthermore, the integration of social sentiment analysis into these platforms has become increasingly essential. Understanding public sentiment towards certain stocks or sectors can provide valuable context that influences market movements. As such, by leveraging investment research platforms effectively, investors can gain a significant advantage in navigating the complexities of the stock market.
Mastering Charting Tools
In the realm of stock market analysis, charting tools serve as vital instruments for investors seeking to monitor stock price movements and identify trends. These tools provide a visual representation of historical price data, thereby enabling investors to make informed decisions based on past performance and future projections. Effective utilization of charting tools requires a firm understanding of how to interpret various chart types, including line charts, bar charts, and candlestick charts.
Line charts are perhaps the most straightforward type of chart, displaying price movements over a specified period. They connect closing prices with a continuous line, which helps investors observe overall trends quickly. Bar charts, on the other hand, offer a more detailed view by displaying the opening, closing, high, and low prices for a given timeframe. This additional detail allows investors to grasp market volatility and make more nuanced assessments of stock behavior.
Candlestick charts have gained popularity due to their ability to convey information rapidly, utilizing different color codes, patterns, and shapes to represent price movements. Each candlestick reflects a specific time interval and includes the same data points as a bar chart but in a visually appealing format. Investors can recognize patterns such as “doji” or “hammer” that often indicate potential market reversals or continuations.
Moreover, understanding support and resistance levels is critical when analyzing charts. Support refers to a price level where a stock tends to bounce back after falling, while resistance indicates a level where a stock tends to reverse direction after rising. Identifying these levels can aid investors in making timely decisions. Ultimately, mastering charting tools empowers investors to visualize stock price movements effectively, interpret critical patterns, and enhance their investment strategies through informed decision-making.
Incorporating Economic Indicators into Analysis
The integration of economic indicators into stock market analysis is a fundamental practice that enables investors to make informed decisions. Economic indicators are statistical measures that provide insights into the overall health of the economy, and they play a crucial role in forecasting market trends. Among the plethora of indicators available, Gross Domestic Product (GDP), unemployment rates, and inflation are considered pivotal.
GDP is one of the most widely monitored indicators, as it represents the total value of all goods and services produced in a country during a specific period. An increasing GDP often signals economic growth, suggesting that businesses are thriving and consumer spending is up, which typically results in higher stock prices. Conversely, a declining GDP might indicate economic contraction, leading investors to reassess the performance of stocks.
Unemployment rates serve as another important economic indicator, providing insight into labor market conditions. High unemployment can deter consumer spending and create an environment of uncertainty among investors, often resulting in a bearish stock market. On the other hand, low unemployment levels usually correlate with economic stability and growth, which can boost investor confidence.
Inflation, measured through indices such as the Consumer Price Index (CPI), reflects the rate at which the general level of prices for goods and services is rising. Moderate inflation is often a sign of a growing economy, but excessive inflation can erode purchasing power and negatively impact corporate earnings, leading to fluctuating stock values. Investors closely monitor inflation data, as it influences interest rates and, consequently, the broader stock market.
By incorporating these economic indicators into their analysis, investors can better understand the market’s dynamics and develop strategies that align with prevailing economic conditions. This comprehensive approach allows for a more nuanced examination of stock performance, ultimately leading to more strategic investment decisions.
Using Risk Assessment Tools
In the realm of investment, understanding and managing risk is paramount. Various risk assessment tools aid investors in evaluating their portfolios and making informed decisions. Among these tools, the beta coefficient, value at risk (VaR), and the Sharpe ratio stand out as essential metrics that every investor should master.
The beta coefficient measures the volatility or non-systematic risk of a stock in comparison to the overall market. A beta of greater than one indicates that the stock is more volatile than the market, while a beta of less than one suggests it is less volatile. Understanding beta allows investors to gauge how much market risk they are willing to accept and adjust their investment strategies accordingly.
Another key tool is the value at risk (VaR), which estimates the potential loss in value of an asset or portfolio over a defined period, given a specified confidence interval. For instance, a VaR of $1 million at a 95% confidence level indicates that there is only a 5% chance that losses will exceed $1 million over a particular time frame. This tool provides a quantifiable measure of risk and is especially useful for portfolio managers who seek to understand the impact of adverse market movements.
The Sharpe ratio is a third essential metric that quantifies the risk-adjusted return of an investment. It is calculated by subtracting the risk-free rate from the return of the investment and then dividing this by the investment’s standard deviation. A higher Sharpe ratio indicates that the investment has a better return for the level of risk taken, making it a favorable option for investors seeking to enhance their returns while managing risk effectively.
Utilizing these risk assessment tools empowers investors to understand better the dynamics of their investments, facilitating informed decision-making and, ultimately, helping to align their risk tolerance with their investment objectives.
Conclusion: Building a Strong Analytical Toolkit
In the world of investing, mastering the right stock market analysis tools is essential for achieving success. Throughout this post, we have explored several critical tools that every investor should consider incorporating into their analytical toolkit. From fundamental analysis tools that evaluate company performance and financial health to technical analysis indicators that assist in identifying market trends, each tool plays a vital role in shaping informed investment decisions.
Moreover, the integration of various platforms and software can streamline the analysis process, enabling investors to access real-time data and gain insights into market dynamics effortlessly. Understanding how to leverage these tools effectively not only enhances an investor’s ability to make timely decisions but also instills a sense of confidence in navigating volatile markets.
It is important to recognize that the landscape of the stock market is continually evolving. Therefore, maintaining a mindset of lifelong learning is crucial for every investor. Engaging with educational resources, attending workshops, and utilizing online courses can further deepen one’s understanding of new tools and techniques. Equipping oneself with the latest information and strategies will greatly assist in adapting to new market conditions and improving investment outcomes.
As you embark on your investment journey, remember that mastering these stock market analysis tools is not just about acquiring knowledge but also about applying it wisely. The synergy of analytical skills and practical application is what ultimately leads to a successful investment career. By remaining proactive and committed to developing your skills, you will be well-prepared to face the challenges in the stock market and uncover promising investment opportunities.