





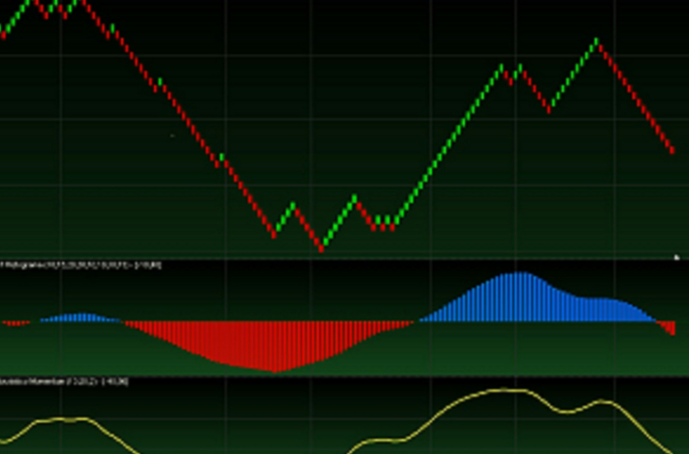
Introduction to Stock Market Trends
Stock market trends represent the general direction in which the prices of stocks are moving over a specific period. Understanding these trends is essential for both novice and seasoned investors, as they provide insights into the market’s overall health and potential future movements. Investors often analyze trends to make informed decisions about buying or selling stocks, as these trends can significantly indicate how specific stocks or the market may perform.
Trends can be categorized into three primary types: upward (bullish), downward (bearish), and sideways. An upward trend signifies that stock prices are generally increasing, indicating investor confidence and potential growth. Conversely, a downward trend suggests declining prices, which may reflect negative market sentiments or economic challenges. Sideways trends, where stock prices remain flat over time, can suggest market indecision or a lack of significant news affecting investor sentiment.
The importance of identifying and analyzing stock market trends lies in their ability to offer predictive insights. By recognizing patterns in price movements, investors can better forecast future behaviors and make strategic investment choices. For instance, a prolonged upward trend may entice investors to buy or hold stocks in anticipation of further gains, while a downward trend could prompt selling to prevent losses. Additionally, understanding these trends can help investors more effectively manage risk and allocate their resources.
Moreover, stock market trends are influenced by multiple factors, including economic indicators, investor psychology, political events, and global market conditions. Therefore, a comprehensive analysis of these elements alongside trend observation is crucial for maximizing investment efficacy. This multifaceted approach serves to empower investors to navigate the complexities of the stock market with greater confidence and precision.
Types of Stock Market Trends
The stock market exhibits various trends, which are classified primarily into three types: bullish, bearish, and sideways trends. Understanding these trends is vital for investors, as they significantly impact investment decisions and portfolio management.
A bullish trend indicates a strong upward movement in stock prices. During this trend, investor confidence is high, and the overall market performance is positive. This typically occurs during economic growth periods or recovery phases. Investors tend to exhibit optimism, leading to increased buying pressure. For instance, if a company releases favorable earnings reports, its stock may experience a surge, exemplifying a bullish trend. Such conditions encourage long-term investors to acquire stocks in anticipation of further price appreciation.
In contrast, a bearish trend represents a downward movement in stock prices. This trend is characterized by declining investor confidence, dropping demand for stocks, and negative market sentiment. Often, bearish trends prevail during economic recessions or when indicators signal fledgling growth. During such times, investors are likely to sell stocks to mitigate losses, which reinforces the downward trend. A classic example would be a significant fall in a major index, such as the S&P 500, during a financial crisis.
Sideways trends, also known as consolidation, occur when stock prices trade within a specific range without a clear upward or downward trajectory. This trend suggests uncertainty among investors, as they await new information or signals that could influence market direction. For example, if a stock fluctuates between $50 and $55 without breaking out of that range, it is considered to be in a sideways trend. This can create opportunities for traders who aim to capitalize on price movements within that defined range.
Historical Stock Market Trends and Their Implications
The analysis of historical stock market trends serves as a crucial element in understanding current market conditions and guiding future investments. Traditionally, investors have relied on historical data to discern patterns and make informed investment decisions. Notably, the stock market has experienced significant fluctuations throughout its history, often driven by a variety of economic, political, and social factors.
One of the most striking trends observed is the long-term upward trajectory of the stock market, particularly in developed economies. Despite experiencing periodic downturns such as the Great Depression in the 1930s, the dot-com bubble burst in the early 2000s, and the financial crisis of 2008, the stock market has shown resilience and a tendency to recover over time. The historical data indicates that, following downturns, markets typically rebound, leading to substantial returns for long-term investors.
Additionally, analyzing trends such as bull and bear markets provides insights into investor behavior and market cycles. Bull markets, characterized by rising stock prices and investor optimism, tend to last longer than bear markets, where declining prices create a climate of fear and uncertainty. Understanding the length and characteristics of these cycles can help investors strategically time their entry and exit points in the market.
Furthermore, studying past market reactions to economic indicators, such as interest rate changes or GDP growth, allows investors to anticipate potential future market movements. This historical perspective underscores the importance of contextualizing current stock market conditions within a broader historical framework. By taking into account previous trends, investors can better interpret current events, making it easier to navigate the complexities of future investment landscapes.
Tools for Predictive Analysis in Stock Markets
Predictive analysis in stock markets relies on various tools and techniques that can be broadly categorized into qualitative and quantitative approaches. Understanding these tools is essential for investors looking to make informed decisions.
One of the fundamental methods in predictive analysis is technical analysis. This approach involves analyzing historical price and volume data to identify patterns and trends in stock movements. Investors use charts and indicators such as moving averages, Relative Strength Index (RSI), and Bollinger Bands to evaluate potential future price movements. Technical analysis is grounded in the premise that historical price action can provide insight into future behavior.
On the other hand, fundamental analysis focuses on evaluating a company’s financial health and intrinsic value. This approach involves analyzing various economic indicators, company earnings reports, balance sheets, revenue models, and market conditions. Investors looking for long-term investments typically employ fundamental analysis, as it allows them to assess whether a stock is undervalued or overvalued compared to its actual worth.
In addition to these analytical methods, sentiment analysis has gained traction in recent years. This qualitative approach gauges the mood or sentiment of investors towards a particular asset using various data sources, such as news articles, social media trends, and financial reports. By analyzing public sentiment, investors can gain insights into potential market movements, as collective investor emotions can significantly influence stock prices.
Moreover, advancements in technology have led to the emergence of machine learning algorithms and artificial intelligence (AI) tools for stock market analysis. These tools analyze massive datasets more efficiently than traditional methods, identifying complex patterns and making predictions based on current market data.
In summary, using a combination of technical analysis, fundamental analysis, sentiment analysis, and modern technological tools can provide investors with a comprehensive toolkit to make predictive analyses in the stock market. Understanding and effectively utilizing these tools is crucial for making informed investment decisions and navigating the complexities of market trends.
Key Indicators for Predicting Market Trends
Understanding the stock market trends is crucial for investors and analysts alike. The efficacy of market predictions often relies on various economic indicators that serve as barometers for future performance. One of the most significant indicators is the Gross Domestic Product (GDP) growth. An increase in GDP typically signals a healthy economy, which can lead to higher corporate earnings and, subsequently, higher stock prices. Conversely, a declining GDP is often a red flag, suggesting decreased consumer spending and corporate profitability.
Another critical metric is the unemployment rate. Low unemployment often correlates with robust economic activity. When more people are employed, consumer confidence tends to rise, which can lead to enhanced spending and investment, fuelling stock market growth. On the other hand, high unemployment can lead to reduced consumer spending and lower corporate profits, negatively impacting stock performance.
Industry-specific metrics also play a vital role in predicting market trends. For instance, manufacturing data such as the Purchasing Managers’ Index (PMI) provides insights into the health of the manufacturing sector. A PMI above 50 generally indicates expansion, while a reading below 50 suggests contraction. Additionally, consumer confidence indices can provide valuable insight into how optimistic consumers feel about the economy, which often affects their spending behaviors and, by extension, the stock market.
Moreover, leading economic indicators, such as housing starts and retail sales figures, offer anticipatory signals regarding market direction. By analyzing these key indicators, investors can gain a more nuanced understanding of potential market trends, assisting them in making informed investment decisions. Utilizing a combination of these metrics enhances predictive accuracy, allowing analysts to better navigate the complexities of the stock market.
The Role of Technology in Predictive Analysis
Advancements in technology, particularly in artificial intelligence (AI), machine learning, and big data, are transforming predictive analysis in the stock market. Historically, market prediction relied heavily on human intuition and traditional statistical methods. However, the integration of technological innovations has offered a new dimension to understanding market behaviors and trends.
AI, for instance, utilizes algorithms that can analyze vast amounts of data more efficiently than human analysts. These algorithms are designed to learn from past data, adjusting their predictions based on new information. This continuous learning capability enhances the accuracy of predictive models, enabling traders and investors to make more informed decisions based on anticipated market movements.
Machine learning, a subset of AI, specifically focuses on developing models that improve automatically through experience. In the stock market, machine learning techniques can identify complex patterns in stock price movements that are not readily apparent through conventional analysis. For example, these models can process historical data, account for various market conditions, and consequently predict potential future trends with increased precision.
Moreover, big data plays a critical role in predictive analysis. The sheer volume of data generated from stock markets and external factors, such as news articles, social media sentiment, and economic indicators, can be overwhelming. By leveraging big data analytics, investors can glean valuable insights from this information, enabling them to identify potential investment opportunities or risks more swiftly and accurately.
In conclusion, the convergence of AI, machine learning, and big data represents a significant leap forward in predictive analysis within stock markets. These technological advancements not only enhance the accuracy and efficiency of market predictions but also empower investors to navigate the complexities of the financial landscape more effectively.
Understanding Risks and Limitations of Predictive Analysis
Predictive analysis in the context of stock market investments plays a crucial role in guiding investors towards more informed decisions. However, this analytical approach is not without its risks and limitations. One primary risk associated with predictive analysis is market volatility. Financial markets are influenced by a multitude of factors, such as economic indicators, geopolitical events, and changes in investor sentiment. These elements can result in abrupt fluctuations that historical data may not adequately account for. Consequently, investments based on predictive models may yield unforeseen losses when external conditions unexpectedly affect market dynamics.
Another significant limitation lies in the reliance on historical data. Predictive analysis often depends heavily on past performance to forecast future trends. However, the stock market is continuously evolving, and patterns that held true in the past may not necessarily repeat. Factors such as technological advancements, regulatory changes, or shifts in consumer behavior could render historical data less relevant. Therefore, investors should be cautious of drawing definitive conclusions from past trends without considering the present context.
Unexpected events, commonly referred to as ‘black swan events’, add another layer of unpredictability to the stock market. These occurrences, which may include natural disasters, sudden economic downturns, or political upheaval, can disrupt even the most robust predictive models. Such unforeseen scenarios underscore the inherent uncertainties involved in stock investments and highlight the necessity of diversifying strategies rather than relying solely on predictive analysis.
In light of these risks and limitations, it becomes evident that while predictive analysis can enhance investment strategies, it should be viewed as one tool among many. Investors must complement predictive insights with a comprehensive understanding of market conditions, risk management strategies, and a vigilant approach to current events that may influence their investment choices.
Case Studies: Successful Predictions in Stock Markets
Predictive analysis in stock markets has proven to be a compelling tool for investors aiming to enhance their decision-making processes. This section explores notable case studies that illustrate the effectiveness of various methodologies in forecasting stock trends.
One illustrative example is the use of machine learning algorithms to predict stock price movements in the technology sector. A significant study analyzed data from various tech companies over a span of ten years, incorporating variables such as market sentiment, trading volumes, and historical price patterns. The researchers deployed regression analysis and neural networks which successfully identified patterns that preceded notable fluctuations in stock prices. The results indicated accurate predictions approximately 80% of the time, showcasing the value of applying advanced analytics to investment strategies.
Another notable case involved the implementation of a quantitative analysis approach focusing on consumer behavior indicators. This method monitored social media trends, online reviews, and economic signals. Investors observed that changes in consumer sentiment often correlated strongly with stock performance. By following these trends, analysts could predict surges in stock values, offering early investment opportunities. One particular case involved a well-known retail company that saw a dramatic rise in stock prices following a positive consumer sentiment index, reinforcing the predictive power of behavioral data.
A third intriguing example is the combination of fundamental and technical analysis, specifically in the context of the energy sector. Analysts examined economic indicators such as oil prices, regulatory changes, and geopolitical events. By integrating these foundational elements with charting techniques, they produced forecasts that highlighted potential market shifts accurately. This methodology enabled investors to capitalize on trends before they fully materialized, thus maximizing their returns.
These case studies underscore the potential of leveraging predictive analysis in stock markets. As investors seek to navigate market volatility, understanding and utilizing these methodologies could provide a competitive edge.
Conclusion and Future Outlook for Investors
In light of the discussions surrounding stock market trends and predictive analysis, it is evident that understanding these elements is crucial for informed investment decisions. Stock market trends provide valuable insights into the performance and potential movements of various equities. By analyzing historical data and market patterns, investors can gain a better grasp of expected future behaviors, which can inform their strategy.
Predictive analysis, a vital tool in the investor’s toolkit, leverages quantitative and qualitative data to forecast potential outcomes in the stock market. Through careful examination of economic indicators, industry shifts, and various data-driven methodologies, investors can enhance their ability to anticipate changes. This proactive approach is essential in an ever-evolving financial landscape, where shifts can occur rapidly and unexpectedly.
As we look to the future, it is important for investors to cultivate a thorough understanding of both macroeconomic factors and specific market dynamics. Integrating predictive analysis with a solid foundation in market trends can create a more comprehensive investment strategy. Diversification, staying updated on market news, and periodic reassessment of one’s portfolio are fundamental practices that can help mitigate risks associated with market volatility.
In conclusion, the intersection of stock market trends and predictive analysis serves as a foundation for successful investing. By staying informed and utilizing these analytical tools effectively, investors can position themselves to make more educated decisions, ultimately enhancing their potential for long-term financial growth. As the market continues to evolve, ongoing education and adaptability will be key components for thriving in the competitive arena of stock investment.