





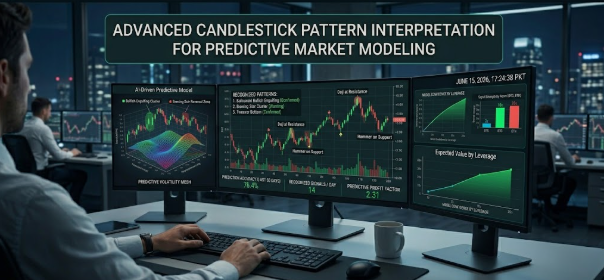
Introduction to Candlestick Patterns
Candlestick patterns have a storied history that traces back to 18th century Japan, where rice traders developed these visual aids to analyze and predict price movements in the rice market. This early form of technical analysis has evolved significantly and is now a fundamental component of modern trading strategies across various financial markets. The significance of candlestick patterns lies in their ability to convey market sentiment and identify potential price reversals or continuations.
At its core, a candlestick represents price movement over a specified period, consisting of a body and wicks (or shadows). The body illustrates the opening and closing prices, while the wicks show the highest and lowest prices within that timeframe. A bullish candlestick, characterized by a closing price higher than its opening price, conveys a sense of market optimism. Conversely, a bearish candlestick indicates that the market is leaning towards pessimism, as the closing price is lower than the opening price. The visual nature of candlesticks allows traders to quickly assess market conditions and make informed decisions.
Understanding these patterns is crucial for effective predictive market modeling. By studying historical price data represented through candlesticks, traders can gain insights into market behavior. Each candlestick pattern tells a story about buyer and seller dynamics, revealing shifts in sentiment that could signal future movements in asset prices. As such, recognizing and interpreting various candlestick formations enables analysts and traders to forecast market trends, ultimately enhancing their trading strategies. The significance of candlestick patterns is not limited to their aesthetic appeal; they serve as powerful tools that help traders navigate the complexities of modern financial markets.
Types of Candlestick Patterns
Candlestick patterns are essential tools in the analysis of financial markets, allowing traders to forecast potential price movements based on historical data. These patterns can be categorized into three main groups: single candlestick patterns, double candlestick patterns, and multiple candlestick patterns. Each of these categories offers unique insights and implications for trading strategies.
Single candlestick patterns are formations consisting of a single candlestick that provides significant information about market sentiment. One popular example is the doji, which occurs when the open and close prices are virtually the same, signaling indecision among traders. The doji can indicate potential reversals, particularly when positioned at the top or bottom of a price trend. Similarly, the hammer and shooting star patterns serve to signify potential market reversals, exhibiting clear bullish or bearish characteristics.
Moving on to double candlestick patterns, these consist of two consecutive candlesticks, allowing for a more nuanced interpretation of market dynamics. The engulfing pattern is a notable example, comprising two candlesticks where the second candle completely engulfs the first. A bullish engulfing pattern usually suggests a strong buying interest following a downtrend, whereas a bearish engulfing pattern indicates selling pressure that may lead to a downtrend. Other double patterns include the harami, which indicates potential reversals, where the second candlestick is contained within the body of the first.
Finally, multiple candlestick patterns involve three or more candles and provide deeper insights into market psychology. Patterns such as the morning star and evening star are examples of three-candle formations that signify potential trend reversals. These formations illustrate shifts in trader sentiment and can serve as crucial indicators for decision-making in trading.
Interpreting Bearish and Bullish Patterns
Candlestick patterns are integral to technical analysis in trading, serving as visual representations of price movements. Recognizing these patterns, particularly bullish and bearish formations, can provide traders with significant insights regarding market trends. Bullish patterns indicate potential upward movement, while bearish patterns suggest downward momentum. Understanding the psychology behind these patterns can greatly enhance a trader’s ability to forecast market behavior.
One of the most well-known bullish patterns is the “Hammer,” which forms after a price decline. The hammer typically indicates a potential reversal, suggesting that buyers are entering the market, resulting in a higher close. Traders often view this pattern positively as it highlights shifting sentiment where buyers are regaining control. Conversely, the “Shooting Star” is a recognized bearish pattern that appears after an upward price movement. This pattern signals potential weakness in a prevailing bullish market, as it indicates that buyers experienced rejection at higher prices, leading to a close lower than the opening.
Further complicating the landscape of market interpretation, the context in which these patterns appear plays a critical role. For instance, bullish patterns appearing at key support levels are often considered more significant, as they align with broader market structures. Similarly, observing a bearish pattern near resistance levels may strengthen the case for a potential downtrend. Additionally, traders must be aware of other indicators, such as volume and market news, which can further validate these patterns. A high trading volume accompanying a pattern generally reinforces its credibility.
Ultimately, proficient interpretation of bullish and bearish candlestick patterns entails recognizing not only the shapes but also the market context and underlying Trader sentiment. Mastery of these concepts equips traders with the tools necessary for successful market modeling.
Advanced Pattern Recognition Techniques
In the realm of technical analysis, recognizing and validating candlestick patterns forms the backbone of effective trading strategies. To augment the basic interpretations of candlestick charts, traders can employ advanced pattern recognition techniques that significantly enhance predictive market modeling.
One pivotal approach is integrating volume analysis into the evaluation of candlestick patterns. Volume serves as a crucial indicator of market strength; therefore, observing changes in the trading volume accompanying specific patterns can validate their reliability. For instance, a bullish engulfing pattern observed alongside increasing volume suggests stronger conviction among buyers, increasing the likelihood of a price reversal. Conversely, a pattern appearing on low volume may indicate weak commitment, thus warranting caution.
Moreover, employing higher time frame confirmations can bolster confidence in the identified candlestick patterns. A pattern appearing on a lower time frame chart, such as the hourly chart, can gain validation from a similar pattern in a higher time frame, like the daily chart. This multilayered approach allows traders to align their strategies with broader market trends, thus improving predictive accuracy.
Additionally, traders should consider confluence with other technical indicators to strengthen their analysis. For example, if a particular candlestick formation coincides with a moving average crossover or a support and resistance level, it provides substantial backing to the predicted market movement. Utilizing such combinatory techniques helps to avoid false signals and enhances the overall assessment of market conditions.
By incorporating these advanced techniques into their trading arsenal, traders can better position themselves to make informed decisions based on validated candlestick patterns, ultimately improving their market modeling efforts.
Integrating Candlestick Patterns into Trading Strategies
In the realm of trading, integrating candlestick patterns into strategic planning can significantly enhance a trader’s ability to make informed decisions. Candlestick analysis involves interpreting market movements through the visual representation of price movements, and when aligned with comprehensive trading strategies, it becomes a powerful tool for predicting future market behavior.
To effectively incorporate candlestick patterns, traders should begin by identifying key patterns, such as dojis, hammers, and engulfing patterns. These patterns can serve as indicators for potential market reversals or continuations. Aligning these signals with a well-structured trading strategy is paramount, where risk management plays a crucial role. Setting appropriate stop-loss orders and defining risk-reward ratios not only mitigates potential losses but also maximizes profit opportunities in alignment with candlestick signals.
Moreover, traders should determine their entry and exit points based on these identified patterns. For instance, a bullish engulfing pattern might prompt a trader to enter a long position at a nearby support level, while establishing an exit point slightly below the next resistance, ensuring they capitalize on upward momentum. Alternatively, if a bearish reversal pattern appears, it may be prudent to close long positions or initiate short sales, thus adhering to a dynamic trading approach.
Additionally, market conditions continuously fluctuate, which necessitates the adaptation of strategies based on the prevailing environment. Traders should regularly assess the contextual relevance of candlestick patterns in relation to market volatility, economic news, and other external factors. By embracing flexibility in their trading strategies, incorporating candlestick patterns can offer valuable insights, leading to more robust and effective trading decisions.
Common Pitfalls in Candlestick Interpretation
Candlestick patterns offer valuable insights into market sentiments and potential price movements. However, traders frequently encounter several pitfalls that may hinder the effectiveness of their analysis. One of the most pronounced issues is an over-reliance on candlestick patterns in isolation. Traders often neglect to consider other market signals, such as volume, trend lines, and broader market trends, which can provide essential context. Without these confirmations, decisions made based solely on candlestick formations can lead to misinterpretation of market dynamics.
Misinterpretations of candlestick patterns also pose significant challenges. For example, a bullish engulfing pattern is often seen as a sign of upward momentum, but if it appears in a strong downtrend without confirmation from other indicators, it may not be a valid signal. It’s crucial to understand that not every pattern will lead to predictable outcomes; thus, context surrounding the formation is essential. Traders should also be aware of the psychological factors that influence market behavior, as these can contribute to misleading price movements.
Lastly, market noise presents another barrier to accurate candlestick interpretation. In volatile markets, price fluctuations may lead to numerous patterns forming within short time frames, creating confusion and potential misguidance. Traders can easily mistake random price movements for legitimate patterns, resulting in false signals. To mitigate this issue, it is advisable to utilize a combination of time frames and incorporate additional technical indicators that filter out irrelevant noise. By being aware of these common pitfalls and integrating a more holistic approach, traders can enhance their proficiency in interpreting candlestick patterns and improve their market predictions.
Practical Examples of Candlestick Analysis
Candlestick analysis is a powerful tool for traders, allowing them to interpret market sentiment and make informed decisions. In this section, we will explore practical case studies where advanced candlestick pattern interpretation has significantly influenced trading outcomes. One notable example occurred in the foreign exchange market during a sharp downturn for the Euro against the US Dollar. Traders noticed the emergence of a bullish engulfing pattern, where a small bearish candle was followed by a larger bullish candle that fully encompassed it. This pattern suggested a potential trend reversal, and traders who acted promptly could capitalize on the ensuing rally.
Another noteworthy instance involved the stock market where the formation of a shooting star at the peak of a bullish trend signaled potential bearish reversal. Observing this advanced candlestick pattern allowed traders to exit positions effectively before a significant price decline. Historical data revealed that acting upon this specific pattern often led to profitable transactions, thereby emphasizing the importance of recognizing candlestick shapes in real-time.
A further example can be drawn from the cryptocurrency market, specifically Bitcoin, which exhibited a doji pattern during a period of intense consolidation. The doji indicated indecision among traders; however, subsequent bullish momentum confirmed the likelihood of an upward breakout. Early adoption of candlestick pattern interpretation helped traders enter the market before the surge, reinforcing the potential for substantial gains.
These practical examples illustrate that integrating advanced candlestick analysis into trading strategies can enhance predictive modeling and boost the likelihood of successful trades. By learning from these historical instances, traders can develop better decision-making skills in various market environments.
Future Trends in Market Modeling with Candlesticks
The landscape of market modeling is rapidly evolving, particularly with the integration of technology into candlestick pattern analysis. Emerging technologies such as artificial intelligence (AI) and machine learning (ML) are reshaping how traders and analysts interpret market data. These advancements not only enhance the precision of predictions but also streamline the decision-making processes involved in trading.
AI-driven algorithms are now capable of analyzing vast amounts of historical market data at an unprecedented speed. By examining past price movements represented through candlestick patterns, these algorithms can identify trends and predict future market behaviors with greater accuracy. This shift towards automated analysis allows traders to adapt to market changes in real-time, facilitating the development of more robust trading strategies.
Machine learning, a subset of AI, plays a crucial role in refining candlestick pattern recognition. By utilizing techniques such as supervised and unsupervised learning, traders can enhance model performance. The algorithms learn from historical data, enabling them to distinguish between various patterns and their potential outcomes. As the system receives more data, it continues to improve its predictive capabilities, thereby maximizing the effectiveness of candlestick-based trading strategies.
Furthermore, automated trading systems have begun to incorporate advanced candlestick analysis, providing a hands-off approach for traders. These systems can execute trades based on preset criteria derived from candlestick patterns, effectively minimizing the influence of emotional decision-making. With the capability to monitor multiple markets simultaneously, automated systems empower traders to capitalize on opportunities that may have been overlooked.
As these technologies continue to advance, the future of market modeling with candlestick patterns will likely see increased efficiency and higher predictive accuracy. By embracing these innovations, traders can gain a competitive edge in a complex and rapidly changing market environment.
Conclusion: Mastering Candlestick Patterns for Better Trading Decisions
In the realm of trading, particularly within financial markets, an in-depth understanding of candlestick patterns stands as an invaluable asset. As we have explored throughout this discourse, advanced interpretation of these patterns can significantly enhance predictive market modeling. Traders and investors who can accurately analyze these formations are equipped to make informed decisions based on historical price movements and market sentiment.
The nuanced recognition of patterns such as Doji, Hammer, and Engulfing formations can provide traders with insights into potential reversals or continuations in market trends. Mastering these patterns necessitates not only technical knowledge but also a keen intuition developed through consistent practice and analysis. The integration of candlestick patterns into one’s trading strategy allows for improved risk management and the potential for increased profitability.
Moreover, the ability to contextualize candlestick signals within broader market developments and indicators further amplifies their efficacy. By marrying candlestick analysis with fundamental and technical analysis, traders can achieve a more holistic view of market dynamics. This multifaceted approach empowers traders to implement strategies that are well-informed and strategically sound.
Ultimately, the journey toward mastering candlestick patterns is one of continual learning and adaptation. As market conditions evolve, so too must one’s approach to interpretation and application. Therefore, embracing the discipline of studying these patterns will foster better trading decisions, ultimately leading to more successful trading outcomes. In conclusion, the expertise gained in candlestick pattern analysis is not merely an enhancement to trading tactics; it is a fundamental skill crucial for navigating the complexities of market movements effectively.