




Introduction to Cryptocurrency Market Analysis
The cryptocurrency market represents a dynamic and rapidly evolving landscape, characterized by the trading of digital currencies like Bitcoin, Ethereum, and many others. Unlike traditional financial markets, the cryptocurrency market operates around the clock, allowing for constant price fluctuations and trading opportunities. Understanding the intricacies of this market is vital for investors and traders seeking to make informed decisions.
One of the crucial components of navigating the cryptocurrency market is the application of technical analysis, which focuses on price movements and trading volumes to forecast future price actions. Through the use of historical data, traders can identify patterns and trends that may signal bullish or bearish market conditions. Technical analysis is not exclusive to cryptocurrencies; however, its relevance has become significantly pronounced in this sector due to the inherent volatility and rapid changes in market sentiment.
Technical indicators play a pivotal role in this analytical approach. These indicators are mathematical calculations based on price and volume, which help traders interpret market behavior and make predictions about future movements. Common examples of technical indicators include moving averages, the Relative Strength Index (RSI), and Bollinger Bands, each serving unique purposes in providing insights into market trends. By employing these indicators, traders can assess market conditions, identify entry and exit points, and manage risk effectively.
In summary, the cryptocurrency market is marked by its unique characteristics and complexities. Technical analysis, bolstered by the use of various indicators, is essential for traders looking to capitalize on market movements and understand underlying trends. This foundation sets the stage for deeper exploration of advanced technical indicators and their application in cryptocurrency trading strategies.
Understanding Technical Indicators
Technical indicators are mathematical calculations based on the price and/or volume of a security, often used by traders and analysts to predict future price movements. In the context of cryptocurrency market analysis, these indicators serve as tools that help investors assess market trends, identify potential entry and exit points, and make informed trading decisions. By interpreting data derived from price charts, technical indicators provide insights into the behavior of market participants and indicate potential shifts in price direction.
Technical indicators can be categorized into several types, each with its unique purpose. The first category is trend-following indicators, which assist traders in identifying the direction of the market trend. Tools such as moving averages and the Average Directional Index (ADX) fall into this category, enabling users to determine whether a bullish or bearish trend is in play.
Momentum indicators come next, measuring the speed at which price changes occur. These indicators, such as the Relative Strength Index (RSI) and Stochastic Oscillator, provide insights into whether an asset is overbought or oversold, thereby indicating potential reversal points.
Volatility indicators are another important classification, which ascertain the degree of price variation over a specific period. The Bollinger Bands and the Average True Range (ATR) are key examples of this type, providing insight into market risk and helping traders adjust their strategies accordingly.
Finally, market strength indicators measure the overall strength of price movements, often considering volume to confirm trends. Indicators such as On-Balance Volume (OBV) and Accumulation/Distribution (A/D) assist traders in understanding whether movements are supported by sufficient volume, thus validating the strength of trends detected by price action.
Popular Technical Indicators Used in Crypto Trading
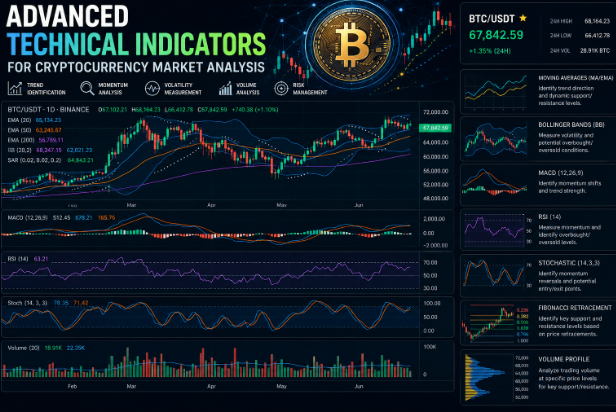
In the realm of cryptocurrency trading, various technical indicators play a pivotal role in assisting traders analyze market trends and make informed decisions. Among these, the Moving Averages (MA), Relative Strength Index (RSI), Bollinger Bands, and the Moving Average Convergence Divergence (MACD) are widely employed for their efficacy.
Moving Averages serve as a simple yet powerful tool to smooth price data and identify trends. This indicator calculates the average price of a cryptocurrency over a specific period, allowing traders to determine the general direction of the market. For instance, a trader might use a 50-day moving average to ascertain whether the price is trending upward or downward. A crossover of shorter-term averages over longer ones often indicates a potential buy signal, while a crossover in the opposite direction may suggest a sell opportunity.
The Relative Strength Index (RSI) is another crucial indicator, providing insights into overbought or oversold conditions in the market. By generating a value between 0 and 100, the RSI helps traders assess momentum. For instance, an RSI over 70 may indicate that a cryptocurrency is overbought, while an RSI below 30 typically suggests that it is oversold. Traders often use this indicator to time their entries and exits effectively.
Bollinger Bands combine moving averages with volatility measures to create a band around price movements. The upper and lower bands represent the standard deviation from the moving average, which helps traders gauge potential reversal points. When prices touch the upper band, it signals a potential sell, whereas touching the lower band indicates a potential buy.
Lastly, the MACD is a trend-following momentum indicator that reveals the relationship between two moving averages. By plotting the MACD line and a signal line, traders can identify bullish or bearish trends based on the crossovers, enhancing their decision-making process.
Advanced Indicators for In-Depth Market Insights
Advanced technical indicators play a crucial role in enhancing our understanding of the cryptocurrency market dynamics. Among them, the Ichimoku Cloud stands out as a comprehensive indicator that provides insights into support, resistance, and potential trend direction. The Ichimoku Cloud, developed in Japan, consists of five key lines that work collectively to predict future price movements. The cloud itself is formed between two of these lines, creating a shaded area that indicates potential support and resistance levels. Traders utilize this indicator to determine optimal entry and exit points, effectively increasing their chances of making profitable trades.
Another widely used advanced indicator is the Fibonacci Retracement Levels. This tool is fundamental for many traders, as it helps identify possible reversal points based on Fibonacci ratios. By plotting the key Fibonacci levels on a price chart following a significant price movement, investors can pinpoint areas where the price is likely to retract before continuing in the original direction. This approach provides traders with strategic insights regarding potential price targets and stop-loss placements, which can enhance their trading performance.
Lastly, the Parabolic SAR (Stop and Reverse) indicator is valuable for identifying potential trend reversals and providing trailing stop-loss levels. The Parabolic SAR appears as dots placed above or below price movements, signaling the current trend direction. When the dots move from above the price to below it, it indicates a potential bullish reversal, and vice versa. This indicator is especially beneficial for traders employing momentum strategies, as it offers clear visuals of market conditions.
Incorporating these advanced indicators into your trading strategy can greatly facilitate deeper market insights, allowing for improved decision-making processes in the ever-volatile cryptocurrency landscape.
Combining Multiple Indicators for Effective Analysis
In cryptocurrency trading, relying on a single technical indicator may not provide the most accurate insights. Traders often face challenges due to the volatile nature of the crypto market, which can lead to misleading signals if only one type of analysis is employed. Therefore, combining multiple indicators is an effective strategy that can significantly enhance the accuracy and reliability of market analysis.
By integrating various indicators, traders can achieve a more comprehensive understanding of market trends. For example, pairing trend-following indicators, such as moving averages, with momentum indicators like the Relative Strength Index (RSI) can yield better confirmation of potential trade signals. While the moving average reveals the direction of price movement, the RSI can indicate whether a cryptocurrency is overbought or oversold, providing a clearer picture of market conditions.
Additionally, volatility indicators, such as Bollinger Bands, can be effectively used alongside volume indicators to confirm breakouts or reversals. When the price of a cryptocurrency reaches an upper or lower Bollinger Band accompanied by a significant increase in trading volume, it serves as a strong signal for potential price action. This multi-faceted approach reduces the risk of false signals and aids in making more informed trading decisions.
Moreover, traders can develop a systematic framework that incorporates these different indicators, each serving a specific purpose. This might involve establishing rules based on the convergence and divergence of signals from various indicators, creating a robust strategy to minimize risk and maximize returns. Ultimately, the combination of multiple indicators not only validates the analysis but also provides a well-rounded perspective on potential market movements.
Limitations of Technical Indicators in Cryptocurrency Trading
While technical indicators play a crucial role in cryptocurrency trading, they are not without their limitations. One of the primary drawbacks is that many indicators are inherently lagging. This means they rely on past price data to generate signals, which can cause significant delays in decision-making. For instance, an indicator may suggest a buy after a considerable price increase has already occurred, thereby missing the optimal entry point for traders. This lagging nature is particularly problematic in the highly volatile cryptocurrency market, where timing is essential to capitalize on price movements.
Furthermore, technical indicators are prone to generating false positives, leading traders to make uninformed decisions. Given the unpredictable nature of cryptocurrency prices, an indicator may signal a bullish trend just before a sharp downturn occurs. As cryptocurrencies can be greatly influenced by external factors, such as market news, regulatory changes, and macroeconomic conditions, relying solely on technical indicators can be misleading.
Additionally, the context in which these indicators are applied must be carefully considered. Market conditions, including trends and volatility, greatly affect the performance of any given technical indicator. For example, indicators that work well during market uptrends may not yield the same effectiveness during bearish periods. This underscores the necessity to utilize a holistic approach when making trading decisions, where technical indicators are combined with fundamental analysis and knowledge of market sentiment.
To navigate the complexities of the cryptocurrency market, traders should not solely rely on technical indicators. Instead, they should integrate a variety of analytical tools and methods to ensure a well-rounded trading strategy. Understanding the limitations of technical indicators can lead to better-informed decisions and ultimately enhance trading outcomes.
Case Studies: Successful Indicator Use in Trade Decisions
In the ever-evolving landscape of cryptocurrency trading, traders have successfully leveraged technical indicators to enhance their decision-making processes and achieve profitable outcomes. This section explores notable case studies where traders employed advanced technical indicators that significantly contributed to their trading successes.
One prominent example revolves around the use of the Moving Average Convergence Divergence (MACD) indicator in the context of Bitcoin trading. A trader identified a bullish crossover when the MACD line crossed above the signal line while confirming the upward momentum through an analysis of the Relative Strength Index (RSI). The strategic entry point was well-timed, leading to a 30% profit over a three-week period as Bitcoin’s price surged. This case highlights the power of combining multiple indicators to validate signals and optimize entry points.
Another illustrative case involves a trader focusing on Ethereum’s price action using the Fibonacci Retracement tool alongside the Bollinger Bands. After observing a pullback to the 61.8% Fibonacci level, the trader noted that the price bounced off the lower Bollinger Band, indicating a potential reversal. Upon entering the trade, the market validated this analysis through a rapid increase in price, resulting in a 25% profit within several days. This situation exemplifies the efficacy of utilizing Fibonacci levels to identify support and resistance in conjunction with volatility indicators.
Moreover, the Ichimoku Cloud indicator has also been employed successfully in various trading scenarios. In a case involving Litecoin, a trader recognized a bullish trend based on the price’s position above the cloud, coupled with a cross of the Tenkan-Sen above the Kijun-Sen. Entering trades under these conditions led to a profit exceeding 40% within a month, underscoring the significance of the Ichimoku framework in assessing market trends.
Through these case studies, it is evident that successful traders effectively utilize advanced technical indicators, integrating multiple tools to formulate informed trading decisions that yield favorable results.
Future Trends in Technical Analysis for Cryptocurrency
The landscape of technical analysis for the cryptocurrency market is rapidly evolving, influenced by advances in technology and growing investor interest. One of the most significant trends is the integration of artificial intelligence (AI) and machine learning algorithms. These technologies are increasingly utilized to analyze vast amounts of data, developing predictive models that can identify patterns and trends with unparalleled accuracy. By leveraging AI, traders can not only enhance their chart analysis but also automate trading decisions based on real-time analytics.
Moreover, machine learning has shown promise in areas such as sentiment analysis, where algorithms process news articles, social media posts, and market reports to gauge public sentiment towards specific cryptocurrencies. This capability can considerably direct investment strategies, particularly in the highly volatile crypto environment where market sentiment may shift dramatically in a short span. As these technologies mature, we can expect their growing prominence in technical analysis, making it more accessible and actionable for traders of all levels.
Another emerging trend is the refinement of chart pattern recognition. Automated systems are now capable of identifying complex patterns such as head and shoulders, flags, and triangles with increasing precision. This traditional aspect of technical analysis is being enhanced by real-time data feeds that adjust for market conditions, leading to more timely and informed trading decisions. The continued improvement in pattern recognition can result in a more effective technical analysis framework, ensuring that market participants remain informed amidst rapid changes.
Furthermore, predictive analytics is gaining traction within the cryptocurrency domain. Utilizing historical data and advanced statistical methods, predictive analytics can generate forecasts that assist traders in making informed decisions. By anticipating potential market movements, traders can strategically position themselves to capture profit opportunities while managing risks effectively. The convergence of these trends signifies a promising future for technical analysis in the cryptocurrency market.
Conclusion: Optimizing Your Trading Strategy with Technical Indicators
As we have explored throughout this discussion, advanced technical indicators play a significant role in cryptocurrency market analysis. They equip traders with essential tools for interpreting market trends, identifying entry and exit points, and ultimately refining their trading strategies. The effective application of these indicators is rooted in understanding their underlying principles and utilizing them within the context of market conditions.
Successful trading requires more than just an awareness of popular indicators like moving averages or RSI; it demands a holistic approach to market analysis. Traders should strive to integrate multiple indicators to confirm signals, thereby improving the accuracy of their predictions. This multilayered analysis not only solidifies trading decisions but also mitigates risks associated with market volatility.
Furthermore, it is crucial to recognize that the cryptocurrency market is continually evolving. What may work today might not yield the same results in the future. Therefore, ongoing education and practice are pivotal in mastering the use of technical indicators. Engaging in simulated trading or using analytical tools to assess performance can provide valuable insights and enhance one’s understanding.
In essence, the journey of optimizing your trading strategy with technical indicators is an ongoing process. It is not solely about employing a specific indicator. Rather, it is about developing a comprehensive strategy that harmonizes various indicators with market analysis and personal trading psychology. By continuously experimenting and adapting, traders can enhance not only their proficiency but also their chances of achieving success in the dynamic cryptocurrency landscape.