




Understanding Market Trends
In the cryptocurrency market, understanding market trends is crucial for effective trading strategies. Market trends broadly categorize into two types: bullish and bearish. A bullish market trend refers to periods when the prices of cryptocurrencies rise, indicating strong buying interest. This optimism often leads traders to take positions in anticipation of further price increases, subsequently driving the prices higher. In contrast, a bearish trend is characterized by declining prices, reflecting a market sentiment of pessimism or fear. During these periods, traders may quickly sell their holdings to minimize losses, which can further contribute to the decrease in prices.
Recognizing these trends is paramount for traders as they influence a variety of trading decisions. For instance, in a bullish trend, traders might look to enter new positions, leveraging the momentum to maximize their profits. They may also choose to hold onto their assets for longer, anticipating that the upward trajectory will continue. Conversely, during a bearish trend, traders are generally more cautious. Many may opt to sell their assets to avoid significant losses, while others might look for short-selling opportunities, betting that the prices will continue to decrease.
In sophisticated technical analysis, several indicators can help traders identify market trends. Tools such as moving averages or the Relative Strength Index (RSI) aid in discerning whether a market is in a bullish or bearish state. Furthermore, traders often consider other factors, including news developments, market sentiment, or macroeconomic indicators that could influence the overall direction of the cryptocurrency market.
In conclusion, grasping the concepts of market trends in cryptocurrency trading is fundamental to devising successful trading strategies. Recognizing bullish and bearish conditions allows traders to make informed decisions that align with their investment goals and risk tolerance.
The Importance of Market Reversal Signals
Market reversals represent critical turning points in trading dynamics, where the prevailing trend shifts direction. They occur when the buying pressure that has driven prices higher diminishes, or the selling pressure that caused a price drop begins to ease, establishing new support and resistance levels. Understanding market reversals is essential for traders, as recognizing these signals can significantly impact investment decisions and overall trading strategy.
Investors often rely on these signals to strategize their entries and exits for various assets, including cryptocurrencies. Market reversals can indicate an opportune moment for purchasing at lower prices or selling to lock in profits before a downturn. The significance of these indicators cannot be overstated, as they can mean the difference between profitable investments and significant losses.
Identifying support and resistance levels is instrumental when analyzing potential market reversals. Support levels represent price points at which a downtrend can potentially pause or reverse, whereas resistance levels denote where an uptrend may stall or reverse. Traders utilize technical analysis to pinpoint these levels, employing historical price data and chart patterns to forecast where reversals are likely to occur.
Moreover, various tools such as moving averages, relative strength index (RSI), and candlestick patterns aid in identifying market reversal signals. Each of these tools offers insights that can enhance a trader’s ability to perceive potential shifts in market sentiment. A strong emphasis on these signals can lead to better-informed trading choices, enhancing the likelihood of achieving favorable outcomes in the volatile cryptocurrency market.
In conclusion, understanding the importance of market reversal signals is paramount for any trader looking to navigate the complexities of the market. By recognizing these crucial indicators and effectively utilizing support and resistance levels, investors can optimize their strategies and make prudent investment decisions.
Technical Analysis Tools for Identifying Reversals
In the ever-volatile cryptocurrency market, recognizing potential reversals is crucial for traders aiming to maximize their profit margins. A variety of technical analysis tools can aid in predicting these turning points in market trends, enabling informed trading decisions.
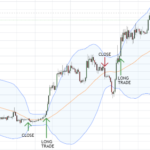
One of the most frequently used tools in identifying potential reversals is the Moving Average. This tool smooths out price data by creating a constantly updated average price, which helps traders to identify the market direction over a specific period. For instance, a short-term moving average crossing above a long-term moving average may indicate a bullish reversal, while the opposite may signal a bearish trend.
Another essential indicator is the Relative Strength Index (RSI). The RSI operates on a scale of 0 to 100 and measures the speed and change of price movements. Generally, an RSI value above 70 suggests that an asset might be overbought, indicating a potential price reversal to the downside. Conversely, an RSI below 30 suggests an oversold condition, which could forewarn of an impending bullish reversal.
The Moving Average Convergence Divergence (MACD) is also noteworthy in this context. This tool combines two moving averages of different lengths and is best known for spotting trend changes. When the MACD line crosses above the signal line, it is often viewed as a bullish signal; conversely, a cross below could point to a bearish reversal. Such movements can provide traders with timely insights into possible price shifts.
In conclusion, tools like Moving Averages, RSI, and MACD play a significant role in technical analysis for cryptocurrency market reversals. By understanding and utilizing these indicators, traders can better anticipate price movements, ultimately enhancing their trading strategies.
Chart Patterns Indicating Reversals
In the cryptocurrency market, traders often rely on various chart patterns to identify potential price reversals. Understanding these patterns can enhance decision-making and facilitate more informed trading strategies. Below are some of the most common chart patterns that signal possible reversals.
The head and shoulders pattern is one of the most recognized reversal indicators in technical analysis. This pattern resembles a peak (head) between two smaller peaks (shoulders). A head and shoulders formation suggests that the market is transitioning from a bullish to a bearish trend. Conversely, the inverted head and shoulders pattern indicates a potential bullish reversal, where the market is expected to shift from a downtrend to an uptrend.
Another significant pattern is the double top, which signals a bearish reversal after an uptrend. It occurs when the asset’s price reaches a peak twice but fails to break through a established resistance level. The double bottom pattern, on the other hand, signifies a potential bullish reversal, forming after a downtrend when the price reaches a low twice.
The flags pattern is also worth mentioning, consisting of a flagpole followed by a rectangular shape. Flags can indicate a brief consolidation period before the prevailing trend resumes. In cases where the flag appears after a strong upward movement, it may denote a continuation of the bullish trend, but if it follows a downtrend, it can signal a potential reversal. Understanding these chart patterns and their implications is crucial for traders aiming to navigate the complexities of the cryptocurrency market effectively.
Candlestick Patterns: A Closer Look
Candlestick patterns are crucial tools used by traders to gauge market sentiment and predict potential price reversals in the cryptocurrency market. Understanding these patterns can provide traders with a strategic advantage, as they often indicate shifts in market trends. Among the most significant candlestick patterns are the bullish engulfing, bearish engulfing, hammers, and shooting stars. Each of these patterns carries its unique implications for market direction and trader behavior.
The bullish engulfing pattern occurs when a small bearish candle is followed by a larger bullish candle that completely envelops the previous candle’s body. This pattern signifies strong buying pressure and is often interpreted as an indication that the market may be poised for an upward reversal. Traders typically look for this pattern at the end of a downtrend, providing a signal to buy or go long on an asset.
Conversely, the bearish engulfing pattern presents a similar concept but in the opposite direction. It forms when a small bullish candle is succeeded by a larger bearish candle that fully encompasses the former. This pattern suggests increased selling activity and is often seen as a precursor to a downward price movement. Recognizing this pattern can alert traders to potential selling opportunities following an uptrend.
Another essential pattern is the hammer. Formed during a downtrend, this single candlestick pattern has a small body and a long lower shadow, resembling a hammer. It indicates that despite selling pressure, buyers have exerted enough strength to push the price back up, which could signal a reversal. The presence of a hammer often serves as a prospective buying signal if confirmed by subsequent bullish candles.
The shooting star is another important reversal signal. Characteristically appearing at the top of an uptrend, this pattern features a small body and a long upper shadow. It suggests that while buyers managed to push the price higher, sellers ultimately dominated, driving the price down by the close. This indicates a weakening bullish sentiment and potential trend reversal to the downside.
Volume Analysis as a Confirmation Tool
In the realm of cryptocurrency trading, volume analysis plays a crucial role as a confirmation tool for market reversals. Trading volume, which refers to the number of assets being traded within a particular time frame, offers insights into the strength of a price movement. When analyzing potential reversals in the cryptocurrency market, traders pay close attention to volume spikes or drops, as these fluctuations often indicate the market’s sentiment and future direction.
High trading volume accompanying a price reversal can act as a strong confirmation signal. For instance, if a cryptocurrency experiences a sudden price increase alongside a surge in trading volume, it suggests that a significant number of traders are willing to enter the market at that price point. This heightened activity indicates that the reversal may be substantial and more likely to hold, as it reflects the conviction of market participants. Conversely, if a price reversal occurs with low trading volume, it raises concerns about the sustainability of that change. Such scenarios may indicate that the reversal lacks the necessary support from traders, making it less reliable.
Conversely, low trading volume can lead to false signals. When a price change happens without a corresponding volume increase, it could suggest that the movement is a mere anomaly, rather than a legitimate shift in market sentiment. Traders often use volume indicators, like the Volume Weighted Average Price (VWAP) or the On-Balance Volume (OBV), to gauge the relevance of price movements in relation to trading volume. By analyzing these metrics, they can better assess the likelihood of a true market reversal.
Overall, incorporating volume analysis into trading strategies allows for improved decision-making. Understanding the relationship between trading volume and market reversals can offer traders an edge, helping them to discern significant trends from fleeting movements in the volatile world of cryptocurrencies.
Market Sentiment Analysis
Market sentiment plays a crucial role in the analysis of cryptocurrency reversals. Understanding the collective feelings and attitudes of investors can provide insight into potential market trends and turning points. Gauging market sentiment involves monitoring various channels, including news articles, social media platforms, and investor behavior patterns. These sources often reflect the mood of the market and can be indicative of future price movements.
News can significantly sway market sentiment. Positive news, such as regulatory approvals or major investments into a cryptocurrency project, tends to boost investor confidence, leading to upward price movements. Conversely, negative news, like security breaches or unfavorable regulations, can lead to panic and selling, catalyzing downward trends. Thus, staying informed about the latest developments is vital for anyone looking to identify market reversals effectively.
Social media has emerged as another powerful tool for sentiment analysis. Platforms like Twitter and Reddit often serve as a barometer for public opinion regarding cryptocurrencies. Here, trends such as hashtags and mentions of specific coins can indicate increasing interest or concern among investors. Tools that analyze sentiment on social media can provide valuable insights into how bullish or bearish the overall market sentiment is surrounding a particular cryptocurrency.
Moreover, investor behavior—illustrated through trading volumes and patterns—offers additional signals of market sentiment. A sudden increase in trading volume can suggest a shift in sentiment, as more traders enter or exit positions. By analyzing these behaviors, traders can identify warning signs of potential reversals. For instance, if a cryptocurrency has been declining for an extended period but suddenly experiences a spike in buying activity, it may suggest that investors anticipate a turnaround.
Combining these elements creates a comprehensive approach to understanding market sentiment. It allows traders and investors to make informed decisions based on a collective understanding of emotional and psychological variables influencing cryptocurrency prices. Recognizing how market sentiment affects reversals is essential for navigating the complexities of the cryptocurrency market effectively.
External Factors Influencing Market Reversals
The cryptocurrency market is characterized by its volatility, with price movements often influenced by various external factors. Understanding the dynamics of these factors can be pivotal for investors looking to recognize potential market reversals. One significant driver of market change is economic news. Announcements related to inflation rates, employment statistics, and GDP growth can dramatically affect investor sentiment and trading behaviors. For example, a positive employment report might instill confidence in the market, prompting a price rally, while adverse economic news could lead to panic selling, triggering a reversal.
Regulatory changes also play a crucial role in shaping the cryptocurrency landscape. Governments around the world are continually assessing how to manage and regulate digital currencies. Any updates regarding stricter regulations or outright bans can lead to sudden shifts in market sentiment. Conversely, favorable regulations that promote adoption and innovation can lead to bullish trends. The reactions to such announcements often precede major price reversals in the cryptocurrency market, highlighting the need for investors to stay informed about global regulatory developments.
Furthermore, significant transactions and market activities can trigger reversals as well. Large trades by institutional investors or “whales” may lead to sharp price movements, creating opportunities for reversal patterns. When whales enter or exit positions in substantial volumes, they can impact the market significantly, often leading to widespread retail trading reactions. Thus, the observation of major transactions can serve as a critical signal for anticipating potential reversals in market trends. By monitoring these external factors—economic indicators, regulatory news, and significant market activities—investors can enhance their strategies and better recognize the moments when a reversal might occur in the cryptocurrency market.
Practical Strategies for Spotting Reversals
Identifying potential reversals in the cryptocurrency market demands a combination of technical analysis and strategic execution. Traders should familiarize themselves with various indicators and concepts that signal shifting momentum. One commonly used method is the examination of trend lines. By observing the highs and lows in price patterns, traders can draw lines connecting these points, which can help identify when the price touches these lines, potentially indicating a reversal.
Another effective strategy involves the use of candlestick patterns. Certain formations, such as pin bars or engulfing patterns, might suggest an imminent reversal. For instance, a pin bar indicates rejection of a specific price level, while an engulfing pattern showcases a strong shift in buying or selling pressure. By keeping an eye on these formations at significant support or resistance levels, traders can enhance their ability to forecast potential reversals.
Moreover, incorporating volume analysis into trading strategies can provide deeper insights. A sudden increase in trading volume accompanying a price movement can signal the strength of a reversal. By comparing the volume during upward and downward moves, traders can gauge whether the momentum is sustainable or likely to falter. Tools such as the Moving Average Convergence Divergence (MACD) and Relative Strength Index (RSI) can also alert traders to potential trend changes when divergence occurs, adding another layer of analysis.
Risk management is critical when attempting to identify reversals. It is essential that traders set predetermined stop-loss levels when entering a trade. This strategy minimizes loss potential should the market move against their initial positions. Additionally, diversifying trades and employing position sizing can mitigate risks further while capitalizing on reversal opportunities. An adaptable approach, combined with these strategies, equips traders to navigate the inherent volatility of the cryptocurrency market effectively.