





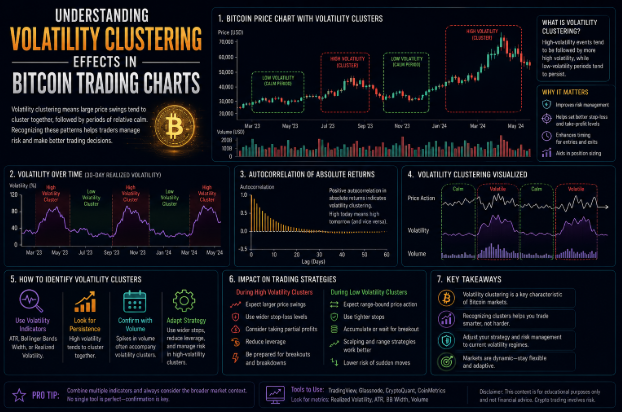
Understanding Volatility Clustering Effects in Bitcoin Trading Charts
Volatility clustering is a phenomenon observed in financial markets, characterized by the tendency of high-volatility periods to be followed by further high-volatility periods, and low-volatility periods to follow low-volatility periods. This pattern is particularly significant in the context of Bitcoin trading due to the inherent unpredictability and dramatic price swings associated with cryptocurrencies. Understanding volatility clustering is crucial for traders, as it can inform their strategies and risk management practices.
The nature of price volatility in Bitcoin trading can be attributed to several factors including market sentiment, regulatory news, and technological advancements. As Bitcoin operates in a relatively nascent market compared to traditional assets, price reactions can be disproportionately amplified. This results in moments of heightened volatility where price fluctuations become more pronounced. Traders must be particularly vigilant during these periods as decisions made under such conditions can greatly affect their portfolios.
Market participants often analyze volatility clustering to gauge potential future price movements. The presence of clustered volatility may serve as an indicator that past price behaviors could inform future trends. For instance, if Bitcoin has been experiencing high volatility, traders might anticipate that this trend could continue, thereby adjusting their strategies to either capitalize on potential profits or mitigate risks. As such, understanding the effects of volatility clustering in Bitcoin trading is essential in developing both short-term and long-term trading strategies.
The Nature of Bitcoin Markets
The Bitcoin market is characterized by a unique set of features that contribute significantly to its high volatility. One of the primary factors is its relative immaturity compared to traditional financial markets. Bitcoin and other cryptocurrencies are still evolving, leading to price unpredictability as market participants grapple with establishing value. As this market matures, we can anticipate changes that may either amplify or mitigate volatility.
In addition to market maturity, liquidity issues in Bitcoin trading also play a crucial role. Liquidity refers to the ease with which an asset can be bought or sold without causing a significant impact on its price. Bitcoin’s liquidity can fluctuate dramatically, particularly during periods of heightened trading activity or sudden market events. When liquidity is low, even small trades can lead to considerable price swings, making the market susceptible to sharp fluctuations.
Regulatory news is another significant influencer of volatility in Bitcoin markets. The cryptocurrency sector is often at the mercy of government policies and regulatory announcements, which can create rapid shifts in market sentiment and, consequently, price volatility. For instance, news of potential regulatory restrictions in a major economy can spark widespread fear among investors, leading to a sell-off that amplifies volatility.
Moreover, social media’s role in shaping public sentiment cannot be overlooked. Platforms such as Twitter and Reddit can drive fast-paced discussions, influencing investors’ perceptions and actions in real time. When influential figures or narratives surface on these platforms, they can lead to sudden spikes or drops in Bitcoin prices, further demonstrating how external factors contribute to the complex nature of Bitcoin volatility.
Indicators of Volatility Clustering
Volatility clustering, a phenomenon where periods of high volatility are followed by high volatility, and periods of low volatility succeed low volatility, can be particularly pronounced in Bitcoin trading charts. To effectively identify and analyze this behavior, various statistical measures are deployed, including the Autocorrelation Function (ACF) and Generalized Autoregressive Conditional Heteroskedasticity (GARCH) models.
The Autocorrelation Function (ACF) is a crucial statistical tool that assesses the correlation of a time series with its own past values. In the context of Bitcoin prices, the ACF can reveal patterns where price movements at one moment correlate with movements observed in prior moments. A significant spike in the ACF at certain lags might indicate the presence of volatility clustering. For example, if Bitcoin trading exhibits persistent large price swings, analysis using the ACF can potentially highlight these recurring patterns, indicating how today’s price behavior might influence tomorrow’s fluctuations.
On the other hand, GARCH models offer a more sophisticated approach by allowing for conditional heteroskedasticity, a situation where the variance of the errors is dependent on previous periods’ behavior. GARCH models effectively capture the variance fluctuations over time, making them particularly well-suited for modeling Bitcoin’s erratic price movements. By utilizing GARCH models, traders and analysts can forecast future volatility based on the historical volatility patterns observed in Bitcoin trading data. For instance, employing a GARCH(1,1) model on historical Bitcoin prices can highlight expected changes in volatility during market events.
These indicators, ACF and GARCH, serve as vital tools for investors and traders, offering insights into the behavior of Bitcoin’s price movements and assisting in making more informed trading decisions amid evolving market conditions.
Impacts of Volatility Clustering on Trading Strategies
Volatility clustering is a phenomenon that significantly influences trading strategies in the context of cryptocurrency markets, particularly Bitcoin. Traders can harness this phenomenon by adapting their approaches to capitalize on the patterns of price fluctuations that emerge during periods of heightened volatility. Understanding how these patterns develop allows for the formulation of effective strategies that align with market behavior.
For instance, swing trading often benefits from volatility clustering as it relies on the ability to identify short to medium-term price movements. Traders can employ this technique by closely monitoring Bitcoin price charts for noticeable volatility patterns, allowing them to anticipate potential reversals or continuations in price direction. By recognizing these clusters, traders can establish entry and exit points that maximize profit potential while minimizing exposure to adverse price movements.
On the other hand, day trading strategies are also affected by volatility clustering. Day traders capitalize on rapid price movements within shorter time frames, and understanding when to expect increased activity can enhance their trading decisions. By analyzing historical data and identifying crucial volatility thresholds, traders can develop systems that trigger trades during optimal market conditions, thus improving their probability of success.
Additionally, options strategies are increasingly being utilized in the context of volatility clustering. Traders often focus on implied volatility levels, which can be influenced by prevailing market conditions. Utilizing options contracts, traders can hedge their positions or speculate on future price movements more effectively when these recognizable volatility clusters emerge.
While there are numerous opportunities presented by such strategies, it is important to note that volatility also implies risks. Sudden price shifts can lead to substantial losses if market movements deviate from anticipated patterns. Therefore, developing a robust risk management plan is essential for traders aiming to exploit the effects of volatility clustering.
Case Studies: Historical Instances of Volatility Clustering in Bitcoin
Volatility clustering is a well-documented phenomenon in financial markets, characterized by the tendency for periods of high volatility to be followed by more high volatility, and periods of low volatility to be succeeded by further low volatility. Bitcoin, as a cryptocurrency, is no stranger to this behavior, with several notable instances throughout its history that exemplify these effects.
One significant instance of volatility clustering occurred in late 2017, when Bitcoin experienced a meteoric rise in value, culminating in its peak price of approximately $20,000 in December. Leading up to this peak, the market saw an increasing frequency of sharp price movements driven by speculative trading and heightened media attention. Subsequently, the volatility did not dissipate; instead, it led to an equally dramatic decline in early 2018, illustrating how high volatility periods can perpetuate themselves in this evolving marketplace.
Another notable case unfolded in March 2020, amidst the global uncertainty of the COVID-19 pandemic. Bitcoin initially plummeted by over 50% within a span of a few days, highlighting a phase of extreme market reaction. This pronounced volatility was followed by an intense recovery phase, characterized by significant price rallies that drew considerable investor interest. Such instances establish that once the market enters a phase of high volatility, traders often experience a repeated cycle that continues until more stable market conditions emerge.
These case studies offer critical insights into how volatility clustering manifests within Bitcoin trading. Understanding these historical instances can aid traders in developing strategies that capitalise on these trends, recognizing that the past behavior of Bitcoin’s price movements often holds predictive power over future actions. By analyzing the developing patterns during high volatility, traders can better navigate the complexities of the cryptocurrency market.
Psychological and Behavioral Aspects of Trading During High Volatility
The dynamic landscape of Bitcoin trading is influenced not only by market trends but also by the psychological state of traders. During periods of high volatility, traders often experience intense emotional responses that can lead to irrational decision-making. Common behavioral tendencies such as panic selling and fear of missing out (FOMO) significantly shape their trading strategies and outcomes.
Panic selling, for instance, is a knee-jerk reaction driven by the fear of potential losses. When prices plummet, traders, overwhelmed by anxiety, may hastily liquidate their assets, often resulting in regrettable decisions. This type of behavior exemplifies how high volatility can amplify psychological pressure, leading traders to focus on immediate reactions rather than strategic planning.
Conversely, FOMO can drive traders to enter positions at inflated prices, motivated by the fear of missing out on significant gains as prices surge. This emotional rush compels traders to act quickly, often without conducting thorough analysis, thus exposing them to greater risk. The psychological grip of FOMO is especially potent in the highly speculative cryptocurrency market, where news cycles can rapidly influence market sentiment.
To navigate these psychological challenges, traders can adopt a variety of techniques to manage stress and maintain composure. Setting clear trading plans that include predefined entry and exit points can help mitigate impulsive decisions. Additionally, developing mindfulness practices, such as meditation or focused breathing, can support emotional regulation during high-stress trading situations.
Moreover, keeping a trading journal to document emotions and decisions can provide valuable insights into behavioral patterns, allowing for more informed future strategies. Understanding these psychological aspects is crucial for traders seeking to make rational, level-headed decisions in the face of volatility, ultimately driving better trading outcomes.
Future Implications of Volatility Clustering in Bitcoin Trading
The future of Bitcoin trading is expected to be influenced significantly by volatility clustering, a phenomenon where large price movements are followed by large movements and small price movements are followed by small movements. As the cryptocurrency market evolves, the implications of this characteristic become increasingly pertinent for traders and investors.
The integration of new technologies, such as artificial intelligence and machine learning, has the potential to alter the dynamics of Bitcoin trading. These technologies could enhance predictive analytics, enabling traders to better understand and capitalize on volatility clustering patterns. For instance, advanced algorithms could analyze historical data at a granular level, uncovering deeper insights into how volatility behaves under certain market conditions, thus enabling more strategic trading approaches.
Moreover, the regulatory landscape surrounding Bitcoin is also likely to affect volatility patterns. As authorities across the globe contemplate stricter regulations, shifts in market sentiment can lead to pronounced volatility. For example, announcements concerning Bitcoin legality or taxation changes can result in abrupt price fluctuations, which would reroute traditional clustering behavior. Traders will need to stay alert to such regulatory developments and their potential impacts on market volatility.
Additionally, market developments, such as increased adoption by institutional investors and mainstream financial institutions, are poised to refine the volatility dynamics in Bitcoin trading. As more capital flows into Bitcoin, the liquidity may increase, leading to potentially diminished volatility clustering effects over time. Conversely, a high concentration of large transactions could intensify volatility clustering since these transactions may carry a higher risk of impacting prices.
In conclusion, the future of Bitcoin trading will undoubtedly be shaped by volatility clustering, technology advancements, regulatory frameworks, and evolving market structures. Understanding these components is crucial for traders and investors aiming to navigate the complex volatility landscape of Bitcoin.
Comparative Analysis with Traditional Markets
Volatility clustering is a prevalent phenomenon in both Bitcoin and traditional financial markets, yet the manifestation and implications differ significantly between these domains. In conventional markets, such as equities or fixed income, volatility clustering typically arises from predictable factors such as economic indicators, financial news, or geopolitical events. These markets are characterized by established regulatory frameworks and historical data patterns that facilitate predictions about price movements. Investors often rely on various analytical methods to gauge volatility, which is influenced by liquidity, market depth, and investor sentiment.
Conversely, Bitcoin, being relatively new and influenced by a different set of dynamics, displays distinctive volatility clustering effects. Price movements in the cryptocurrency market are often driven by speculative trading, technological advancements, and regulatory updates unique to digital assets. As a result, Bitcoin is prone to rapid price swings that can amplify volatility clustering, making it more pronounced compared to traditional assets. This increased volatility can create opportunities for traders, but it also elevates the risks associated with investing in cryptocurrencies.
When comparing the two worlds, there are notable lessons for Bitcoin traders drawn from traditional market behavior. For instance, understanding how external factors impact volatility in conventional assets can provide insights into managing risk within the more turbulent waters of Bitcoin. Traders can benefit from integrating technical analysis, statistical volatility measures, and news sentiment tracking, akin to methods employed in traditional finance. By doing so, they can enhance their strategies and potentially mitigate the risks associated with high volatility environments. In essence, while the underlying principles of volatility clustering may resonate across both types of markets, the specific strategies and approaches to trading must be distinctly tailored to accommodate the characteristics of Bitcoin and other cryptocurrencies.
Conclusion and Final Thoughts
In conclusion, understanding volatility clustering in Bitcoin trading charts is paramount for traders aiming to enhance their success. Throughout this blog post, we have explored the nature of volatility clustering, its implications for market behavior, and how traders can leverage this phenomenon to make informed decisions. The significance of recognizing periods of high and low volatility cannot be overstated, as these fluctuations can provide invaluable insights into potential market movements.
By grasping the concept of volatility clustering, traders can develop strategies that not only account for current market conditions but also anticipate future price actions in the Bitcoin landscape. The cyclical patterns of volatility often reflect underlying market sentiment and external economic factors. Consequently, this understanding allows traders to position themselves better during both favorable and adverse conditions, thereby optimizing their trading strategies.
As the Bitcoin market continues to evolve at a rapid pace, traders must remain adaptable and informed. Continuous education and observation of market trends will equip traders to respond effectively to volatility shifts. By integrating analytical tools that take into account volatility clustering, traders are better prepared to capitalize on potential profit opportunities while mitigating risks associated with abrupt market changes. Staying connected with reliable sources of information will also aid in navigating the complexities of cryptocurrency trading.
In closing, as you move forward in your Bitcoin trading endeavors, remember that volatility clustering is a critical concept that can influence your trading decisions significantly. Maintaining an agile approach and a well-informed perspective will be essential as you navigate the dynamic landscape of Bitcoin trading.